Detailed Charts
For each goal there is the possibility to display detailed history graphics.
All variants are displayed for the goal, depending on the time at which they were added.
There are two different types to show:
- representation based on cumulated data
- representation based on day-wise data
Using the example of a runtime of three days, the representation differs in the following method:
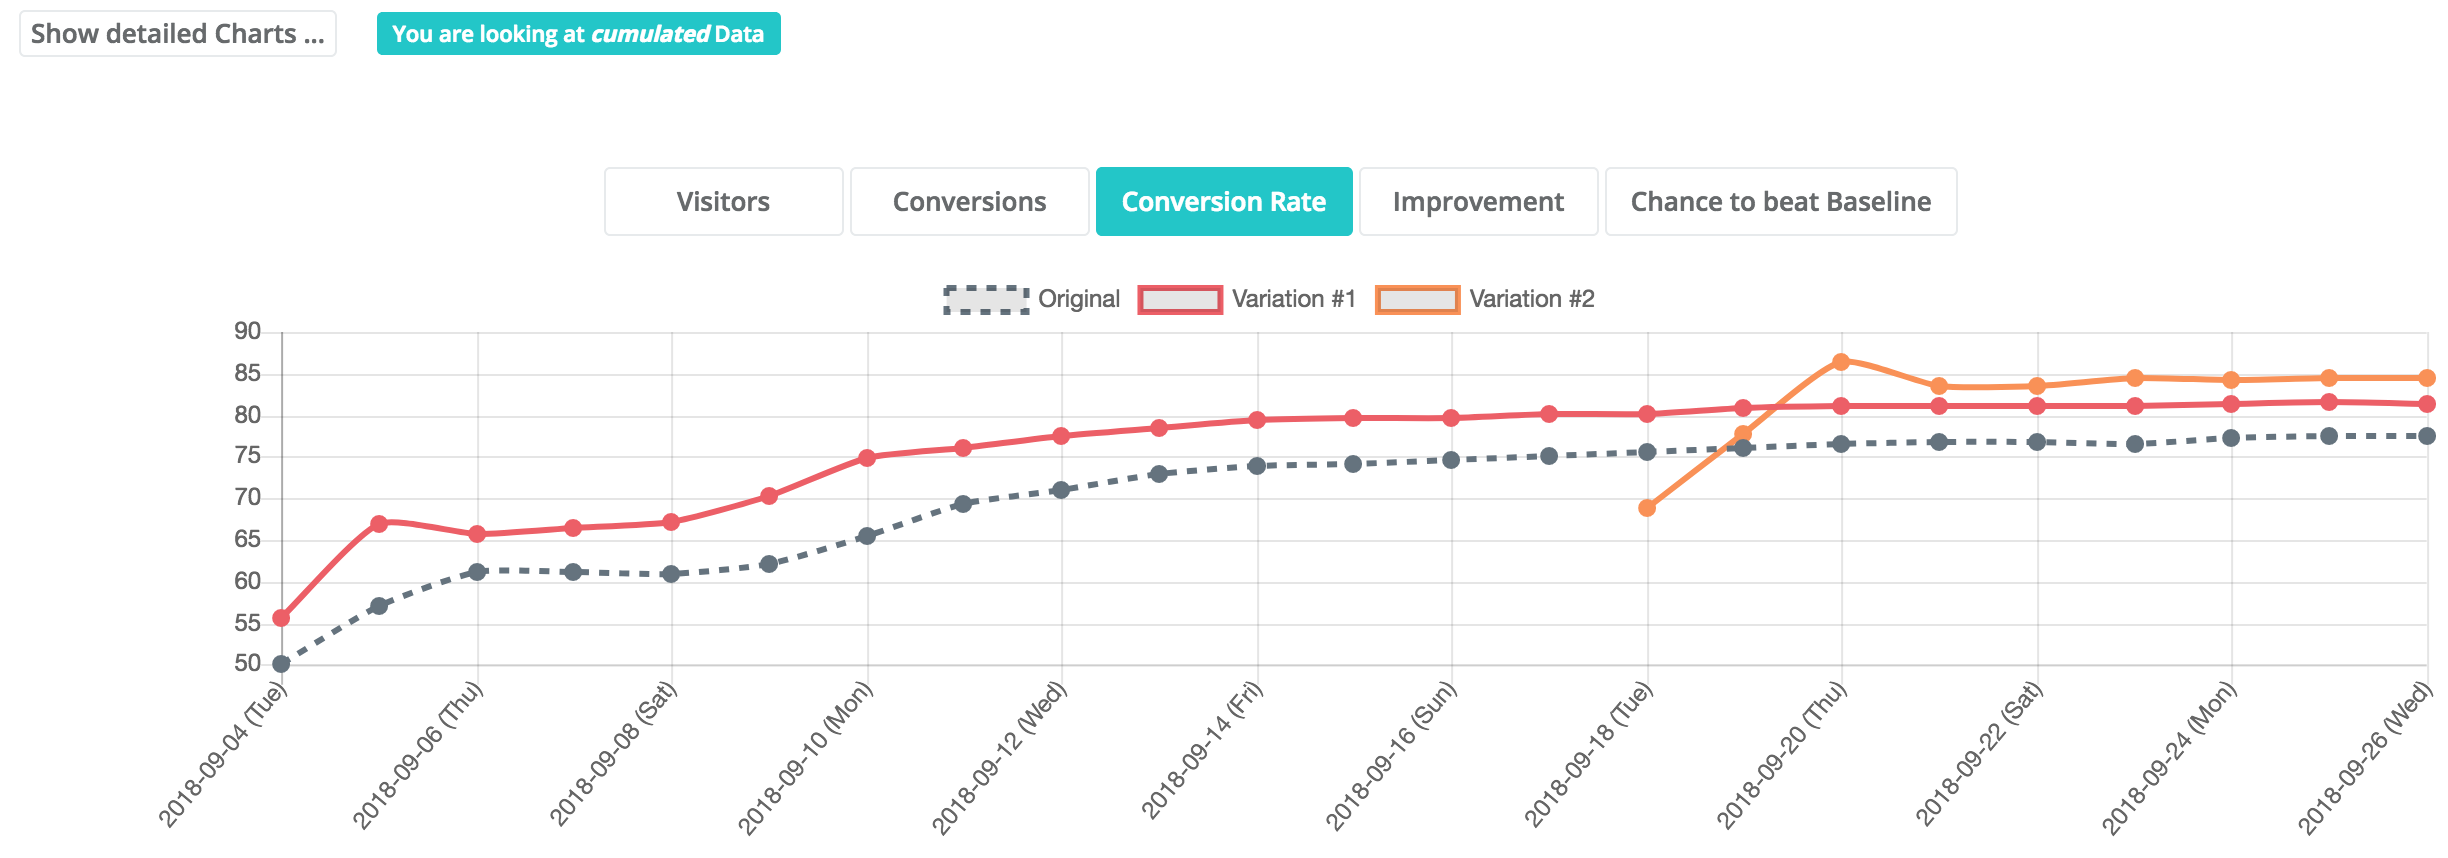
Cumulated representation
1st data point: day 1
2nd data point: day 1 + day 2
3rd data point: day 1 + day 2 + day 3
Day-wise representation
1st data point: day 1
2nd data point: day 2
3rd data point: day 3
The cumulated representation is therefore best suited for tracking the progress of the results.
The day-by-day (day-wise) representation is well suited for detecting outliers or errors in the measurement or experiment/variations. These can be caused, for example, by a change in the tracking triggers or by changes to the website (deployment).